Digital printing can reduce setup time, support shorter runs, and make variable data practical. Yet a faster press does not automatically produce a stronger business case. To understand what is the return on investment for digital printing systems, compare the full cost of ownership with measurable savings and new revenue. Include equipment, software, service, ink, substrates, operator time, financing, and installation. Then examine waste sheets, make-ready time, outsourced work, and jobs the current workflow cannot profitably handle.
Printing-industry analyst Marco Boer is a recognized voice on print technology and markets. Rather than inventing a verbatim quotation, this guide uses a concise paraphrase of the practical question behind ROI analysis: “Measure the economics of the work, not just the speed of the press.” Start with real job records: a 500-copy run, minutes spent preparing plates, material discarded during setup, and labor hours per shift. Compare those figures with realistic digital-production estimates, then calculate payback and ongoing returns. Small details matter.
The result will not be perfect. Forecasts can miss changing demand, maintenance costs, or idle capacity. Treat assumptions as assumptions, test more than one production scenario, and revisit the calculation after installation. That discipline makes the ROI estimate more credible—and more useful for deciding whether a digital printing system fits your operation.
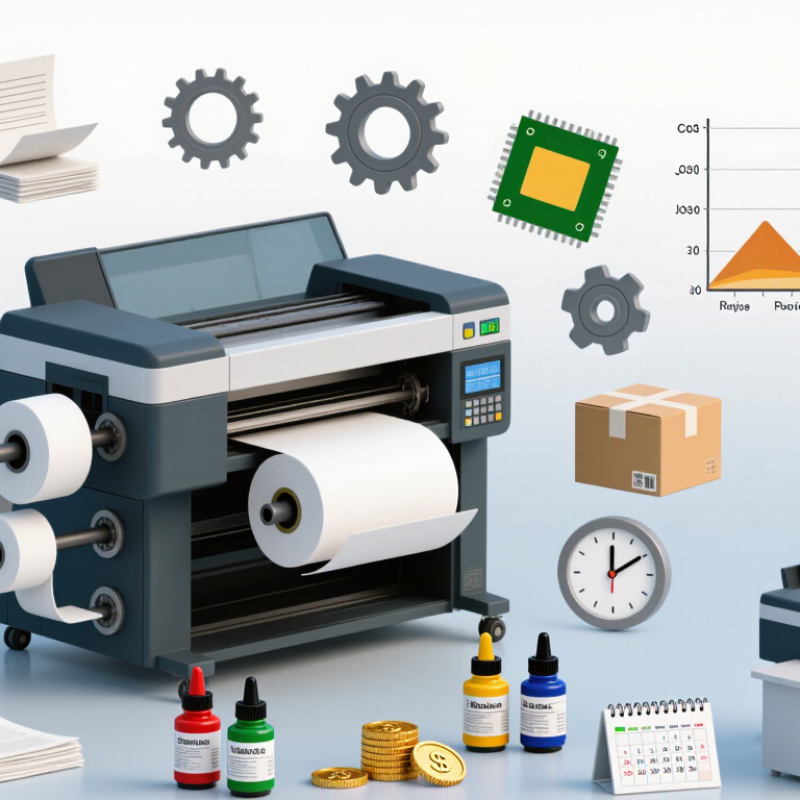
Before calculating ROI, define exactly what “the system” includes. Count the press, workflow software, installation, training, finishing equipment, and any required facility upgrades. Keep it bounded. Record baseline costs for outsourced work, current labor, substrates, energy, maintenance, and rejected sheets. Compare the same job mix and volume before and after installation; otherwise, higher sales or changing material prices may distort the result. Smithers’ 2023 report, The Future of Digital Printing to 2028, projected the global digital print market would reach $230.5 billion by 2028. That forecast signals market growth, not guaranteed savings for one shop. Use it as context, not as an input to your ROI formula.
Choose an evaluation period that captures installation, operator training, and realistic production ramp-up. A three-year view may suit a short replacement cycle, while a longer period can better reflect durable equipment; test both if uncertain. Include cash flows by year, such as consumables, service contracts, labor changes, downtime, and resale value. Compare them with measurable benefits, including reduced outsourcing and faster job turnaround. Keep the assumptions visible. One weak spot is often spoilage: early production runs may waste more media than steady-state estimates suggest. Use actual job tickets and invoices where possible, then review the model after several months of operation.
| Area | Evaluation Item | Illustrative Value or Definition | Scope and Evaluation Treatment |
|---|---|---|---|
| System scope | Equipment included | One production digital printing system, including its standard controller and finishing interface | Include only equipment required for the defined production workflow. Exclude unrelated office printers and equipment not affected by the investment. |
| System scope | Implementation costs | Equipment: $145,000 Installation and workflow integration: $12,000 Operator training: $3,000 Total initial investment: $160,000 |
Count one-time, project-related costs at the start of the evaluation period. Use actual quotations and internal project costs when available. |
| Production scope | Annual production volume | 2,000,000 sellable A4-equivalent impressions per year | Use the same output unit and annual volume for the current process and proposed system. Exclude spoilage from sellable output, but include its cost in the relevant cost-per-impression estimate. |
| Baseline | Current-process variable cost | $0.078 per sellable impression | Include comparable consumables, substrate, and production waste. Confirm that the estimate uses the same paper specification and output quality as the proposed system. |
| Proposed system | Digital-system variable cost | $0.055 per sellable impression | Include consumables, substrate, and expected production waste. Base the estimate on representative jobs and actual operating conditions. |
| Annual benefits | Variable-cost savings | ($0.078 − $0.055) × 2,000,000 = $46,000 per year | Calculate using the cost difference multiplied by the shared annual production volume. |
| Annual benefits | Setup and labor savings | $12,000 per year | Include only supportable reductions in setup time, makeready labor, or related production effort. Avoid counting the same labor saving in more than one category. |
| Annual costs | Incremental service and software | $8,000 per year | Include recurring service, software, and other costs that are additional to the current process. |
| Net annual benefit | Operating benefit after incremental recurring costs | $46,000 + $12,000 − $8,000 = $50,000 per year | Assumes annual volume, unit costs, and recurring costs remain constant throughout the evaluation period. |
| Evaluation period | Start and end points | Five years from system acceptance and production release | Use a consistent period for both costs and benefits. Include ramp-up effects if the system will not reach normal production immediately. |
| Evaluation period | Five-year simple ROI | [(5 × $50,000) − $160,000] ÷ $160,000 × 100 = 56.25% | Illustrative, undiscounted calculation. It excludes taxes, financing, inflation, residual value, and revenue changes. Add these items when relevant to the business case. |
Illustrative planning assumptions only; actual costs and production results vary by job mix, materials, utilization, labor rates, and service terms. Replace the example values with verified operational data and current quotations before making an investment decision.
Include the press, software, installation, delivery, training, and finishing equipment. Add electrical, ventilation, or site upgrades. Small setup fees can matter.
Track ink, printheads, cleaning supplies, substrates, maintenance, energy, and labor. Include service contracts and downtime. Waste counts too.
Use recent job tickets, invoices, and production records. Calculate material cost per usable square foot, including test prints and misfeeds. Estimates can still miss things.
Compare the same job mix and volume over the same period. Measure outsourcing, labor hours, reprints, material waste, and turnaround time.
Subtract added costs from added savings and revenue to find annual net benefit. Divide that benefit by the installed investment, then multiply by 100.
Divide the initial investment by average monthly net benefit. For example, $120,000 divided by $8,000 monthly equals 15 months. Not a promise.
Include installation, training, and a realistic production ramp-up. Compare a three-year view with a longer period if equipment life is uncertain.
Test cautious, expected, and optimistic order volumes. Early runs may waste more media than steady production. Review the assumptions after several months.
Evaluating a digital printing system begins by defining its scope and the period over which it will be assessed. Include the equipment and workflows being considered, then identify the full initial investment, such as purchase, installation, and training expenses. Estimate ongoing operating costs too, including labor, materials, maintenance, and energy, so the analysis reflects the system’s total cost over time.
Next, estimate measurable revenue gains and cost savings, such as increased production capacity, reduced waste, shorter turnaround times, or less outsourcing. Subtract total costs from the expected financial benefits to determine net benefits, then use them to calculate ROI. Asking “what is the return on investment for digital printing systems” is most useful when the calculation is paired with a payback-period estimate and clear assumptions. Comparing results under different scenarios can show how changes in print volume, operating costs, or revenue affect the investment’s expected performance.

 Magly Printer