What Is Surface Decoration Efficiency and How to Improve It?

Time:2026-10-25 Author:Mason
0%

Surface decoration efficiency measures how effectively a production line converts time, materials, labor, and machine capacity into consistent decorative output. It is not simply the number of printed, coated, embossed, or labeled pieces produced each hour. A faster line can still perform poorly when ink coverage varies, registration drifts, or rejected pieces increase.

W. Edwards Deming, a respected authority on manufacturing quality, stated, “If you can't describe what you are doing as a process, you don't know what you're doing.” His principle applies directly to how to improve efficiency in surface decoration processes. Teams need to observe every stage, from artwork preparation and substrate cleaning to curing, inspection, and packaging. A practical review may reveal ten minutes of avoidable setup delay, repeated nozzle cleaning, or excessive material waste beside the press. Small losses become expensive at scale.

Improvement usually begins with measurable evidence. Track cycle time, first-pass yield, changeover duration, rework, material consumption, and unplanned downtime. Standardized color references, controlled drying conditions, and preventive maintenance can reduce variation. Digital work instructions may also help operators repeat successful settings. Yet efficiency is not perfectly predictable. A coating that performs well on glass may behave differently on recycled plastic. My own caution is simple: never trust one trial. Test under production conditions, record the weak points, and revise the process honestly. Better decoration is not only faster. It is stable, repeatable, and visibly consistent.
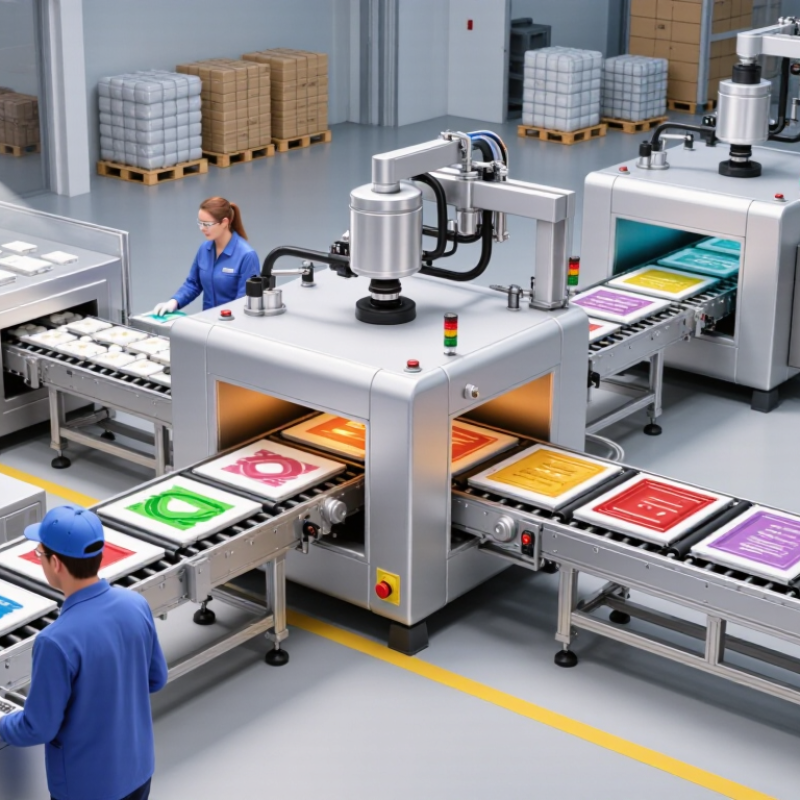
What Is Surface Decoration Efficiency and How to Improve It?

What Is Surface Decoration Efficiency?

Surface decoration efficiency describes how effectively a process converts prepared surfaces, time, and materials into consistent finished results. It is not simply the percentage of painted, printed, or coated area. A practical measure compares acceptable decorated area with total prepared area, then considers labor, material waste, rework, and cycle time. For example, 92% coverage sounds strong. Yet peeling edges or uneven color can make that result inefficient. Quality must remain part of the measurement. It is a balance.

In real workshops, I assess samples after curing, not immediately after application. I check edge definition, color uniformity, adhesion, and visible defects under steady lighting. The results are recorded against material used and minutes spent per unit. This evidence reveals hidden losses, such as overspray, clogged tools, repeated cleaning, or rejected pieces. A simple log often works better than a complicated dashboard. Measure the waste honestly. One weakness remains: lighting and inspector judgment can change results. Clear acceptance photos and shared inspection rules reduce that variation.

Improvement begins with surface preparation. Remove dust, oil, moisture, and loose particles before decoration starts. Start with the surface. Use controlled application speed, consistent pressure, and defined drying conditions. Small test panels can expose problems before a full batch is processed. Adjusting viscosity or tool settings may improve transfer efficiency without sacrificing appearance. Process checks should happen during production, not only at the end. My early evaluations focused too heavily on coverage percentages. That approach missed durability and rework costs. A better review combines coverage, first-pass acceptance, material consumption, labor time, and service performance. The target is not maximum speed. It is repeatable quality with fewer surprises.

Which Factors Affect Surface Decoration Efficiency?

Surface decoration efficiency describes how quickly and consistently a surface receives its intended finish. It includes coverage, adhesion, visual quality, material use, and production time. In practical work, efficiency is not simply a faster machine. A clean substrate often matters more. Dust, oil, moisture, and uneven texture can weaken decoration and create rework. Small defects become expensive at scale.

Surface energy strongly affects how coatings, inks, or films spread. Low-energy materials may need cleaning, abrasion, or controlled surface treatment. Viscosity also matters. A mixture that is too thick leaves gaps, while a thin mixture may run or waste material. Temperature and humidity change drying behavior. Even a slight workshop temperature shift can alter color, gloss, and curing speed. Measure these conditions instead of relying on touch.

Equipment settings influence results as well. Pressure, speed, alignment, and tool condition should match the material and surface shape. Experienced operators usually detect problems early, but visual judgment alone is unreliable. Use adhesion checks, thickness readings, color comparisons, and sample records. A perfect-looking first sample can mislead. I have seen production teams adjust speed when contamination caused the real failure. Process reviews should include operator technique, material storage, and maintenance history. Efficiency improves when each variable is tested separately, although real production rarely stays perfectly controlled.

How Is Surface Decoration Efficiency Measured?

Surface decoration efficiency is measured by how much finished surface meets the required standard, not merely by production speed. A practical formula is: accepted decorated units divided by total produced units, multiplied by 100. Track first-pass yield, decoration speed, material usage, rework, and energy per accepted unit. A fast line can still perform poorly when defects increase.

Quality data needs consistent instruments and sampling. ISO 12647-2 supports color process control, while color differences can be recorded with CIELAB values and ΔE calculations. Gloss is measured under ISO 2813, often at a 60-degree angle. Adhesion can be rated from 0B to 5B under ASTM D3359-22, after cross-cut or pull testing. These figures create a clearer efficiency profile than visual inspection alone. The 5B result looks excellent. It is not enough.

A 2024 packaging operations report from an industry research group highlights waste reduction, uptime, and first-pass quality as connected performance measures. In practice, operators should inspect samples at start-up, after stoppages, and during speed changes. Record defects by type, location, and time. A small camera system can reveal streaks around edges that operators miss under factory lighting. The weak point is sampling. Ten perfect pieces may hide a poor full-shift result. I still question any efficiency claim that excludes rejected material, cleaning time, or energy use.

What Is Surface Decoration Efficiency and How to Improve It? - How Is Surface Decoration Efficiency Measured?
Measurement Dimension Definition Measurement Method or Formula Example Result Why It Matters
Production Batch The quantity of parts evaluated during one measurement period. Count all parts entering the surface-decoration process. 1,000 parts Creates a consistent basis for comparing efficiency between production periods.
First-Pass Yield (FPY) The percentage of parts that meet decoration requirements without rework. First-pass accepted parts ÷ total processed parts × 100. 910 ÷ 1,000 × 100 = 91.0% A higher FPY indicates fewer defects, less rework, and better process stability.
Final Good-Part Yield The percentage of processed parts that meet requirements after approved rework. Final accepted parts ÷ total processed parts × 100. 960 ÷ 1,000 × 100 = 96.0% Shows the final usable output, while also revealing the hidden cost of rework.
Decoration Defect Rate The percentage of parts rejected because of defects such as incomplete coverage, scratches, color variation, or adhesion failure. Scrapped parts ÷ total processed parts × 100. 40 ÷ 1,000 × 100 = 4.0% Helps identify quality losses and prioritize corrective actions.
Rework Rate The percentage of parts requiring an additional decoration operation before acceptance. Reworked parts ÷ total processed parts × 100. 50 ÷ 1,000 × 100 = 5.0% High rework consumes labor, materials, equipment time, and inspection capacity.
Surface Coverage Completeness The proportion of the specified decoration area that is covered continuously and within the required appearance limits. Covered compliant area ÷ specified decoration area × 100, measured by calibrated visual inspection or image analysis. 98.5% Confirms that the decoration reaches the required areas without gaps, exposed substrate, or excessive overlap.
Material Utilization Efficiency The percentage of applied decoration material that remains on the finished parts. Material retained on accepted parts ÷ total material issued × 100. 9.4 kg ÷ 12.5 kg × 100 = 75.2% Higher utilization reduces overspray, waste, disposal costs, and material consumption.
Good-Part Throughput The number of accepted decorated parts produced per hour. Final accepted parts ÷ total elapsed production hours. 960 ÷ 8 = 120 parts/hour Combines production speed and quality into a practical output measure.
Effective Cycle Time The average elapsed time required to process one part, including normal handling and process time. Total production time ÷ total processed parts. 480 minutes ÷ 1,000 = 0.48 minute/part Shorter cycle time can increase capacity when quality and coverage remain stable.
Labor Productivity The number of accepted parts produced per direct labor hour. Final accepted parts ÷ direct labor hours. 960 ÷ 16 = 60 parts/labor-hour Shows whether staffing, workstation layout, and standard work are being used efficiently.
Equipment Availability The percentage of scheduled time that the decoration equipment is available for production. Available production time ÷ scheduled time × 100. 408 minutes ÷ 480 minutes × 100 = 85.0% Low availability may indicate breakdowns, cleaning delays, setup losses, or material shortages.
Energy Consumption per Good Part The electrical energy used to produce one accepted decorated part. Total process energy ÷ final accepted parts. 54 kWh ÷ 960 = 0.056 kWh/part Supports energy monitoring and comparison of process improvements.
Measurement Frequency How often the efficiency indicators are recorded and reviewed. Record batch-level data for output, defects, rework, material, time, and energy; review trends weekly or per production change. Each batch plus weekly trend review Frequent measurement helps detect process drift before it creates large losses.
The numerical results above use a consistent 1,000-part example dataset for demonstrating the measurement method. Actual efficiency values should be calculated from verified production, inspection, material, labor, equipment, and energy records.

What Methods Improve Surface Decoration Efficiency?

Surface decoration efficiency improves when more parts receive an even finish with less rework, material, and processing time. In practice, efficiency begins before coating starts. Clean surfaces are essential. Oil, dust, and oxidation can create tiny gaps, dull patches, or poor adhesion. A controlled cleaning sequence, followed by complete rinsing and drying, gives the decorative layer a more stable foundation.

Process control matters every day. Operators should maintain the recommended temperature, chemical concentration, pH, and current density. Small changes can produce visible shade differences. Gentle agitation helps fresh solution reach corners and recessed areas. Correct racking also reduces contact marks and uneven coverage. Test coupons placed beside production parts can reveal problems early. They are simple, but useful. Calibrated meters and regular bath analysis improve reliability. Written records make unusual results easier to trace.

Inspection should combine appearance checks with measurable tests. Examine gloss, color, coverage, adhesion, and coating thickness under consistent lighting. Excessive thickness may waste material without improving performance. Too little thickness can increase rejects later. I have found that rushed inspections often miss defects near edges and holes. That weakness deserves attention. Reviewing reject patterns can identify poor cleaning, unstable settings, or unsuitable fixture design. Small trials should be documented before changing the full process. Not every adjustment works as expected, and experienced teams should question their own assumptions.

How Can Efficient Surface Decoration Be Applied in Practice?

Efficient surface decoration starts with the production line, not the artwork. Measure substrate absorption, coating coverage, registration accuracy, curing time, and rejected units. A practical trial should compare decoration quality against line speed and material use. According to Smithers’ The Future of Digital Print for Packaging to 2028, digital packaging print is projected to grow from about $22 billion in 2023 to $36.9 billion by 2028. This growth reflects demand for shorter runs, variable designs, and reduced setup waste.

In practice, teams can use digital printing for small batches and conventional processes for stable, high-volume orders. Inline cameras should check color density and position before products reach packing. Standardized inspection samples also help operators detect scratches, uneven gloss, or weak adhesion. The International Organization for Standardization recommends controlled color measurement through standards such as ISO 12647. Yet efficiency is not only about speed. Excessive line speed can create curing defects and hidden rework. That is where our process can improve.

Tips: Test three decoration settings before full production. Record ink usage, energy consumption, setup minutes, and defect rates. Keep one finished sample from every shift. Use simple dashboards, but question the numbers when results look unusually perfect. A clean report may still hide poor adhesion after transport. Surface decoration becomes more efficient when design, equipment, and quality control are managed as one system.

Surface Decoration Efficiency in Practical Production

Surface decoration efficiency can be evaluated through output per labor hour, first-pass yield, and rework rate. The chart compares typical production results before and after practical improvements such as standardized setup, automated inspection, optimized ink or coating parameters, and operator training.

Higher output and first-pass yield indicate more efficient decoration, while a lower rework rate reduces material waste, downtime, and labor consumption.

FAQS

What is the first step toward efficient surface decoration?

Start with a clean substrate. Remove oil, dust, and oxidation before coating. Rinse and dry surfaces completely. Small gaps can ruin an otherwise attractive finish.

Which process settings require daily control?

Monitor temperature, chemical concentration, pH, and current density. Small changes can create visible shade differences. Record each result. Memory is not enough.

How can recessed areas receive more even coverage?

Use gentle agitation to move fresh solution into corners and holes. Correct racking also reduces contact marks. Fixture design deserves more attention than it often receives.

How can teams reduce coating waste?

Measure coating thickness instead of adding material automatically. Excessive thickness wastes resources without improving performance. Too little thickness may cause later rejects. More is not always better.

What inspections should a decoration process include?

Check gloss, color, coverage, adhesion, and thickness under consistent lighting. Inspect edges and holes carefully. Defects often hide there. Rushed checks can miss them.

How can digital and conventional decoration methods be used efficiently?

Use digital methods for short runs or changing designs. Use conventional methods for stable, high-volume production. Compare line speed, material use, and rejected units. The fastest option may create hidden rework.

How can teams identify problems before full production?

Test three decoration settings on small trial batches. Record setup minutes, energy use, material consumption, and defect rates. Keep one finished sample from every shift. Small trials matter.

Which tools improve production consistency?

Use calibrated meters, regular solution analysis, inline cameras, and standardized inspection samples. Simple dashboards can reveal unusual trends. A perfect report may still hide weak adhesion after transport.

How should teams respond when results change unexpectedly?

Review cleaning, equipment settings, fixture design, and curing conditions. Compare reject patterns over time. Not every adjustment works. Experienced teams should question their assumptions.

Conclusion

Surface decoration efficiency refers to how effectively a decoration system transforms time, materials, labor, and energy into consistent, high-quality finished products. It is influenced by surface preparation, equipment capability, coating or printing properties, operator skill, production speed, curing conditions, and the complexity of the design. Efficiency can be measured through indicators such as output per hour, material utilization, defect and rework rates, setup time, energy consumption, and overall production cost.

To understand how to improve efficiency in surface decoration processes, manufacturers can standardize preparation procedures, select suitable materials, optimize equipment settings, and use reliable inspection methods throughout production. Automation and digital process monitoring may reduce variation and shorten changeover times, while preventive maintenance helps avoid interruptions. In practical applications, efficient decoration should balance appearance, durability, productivity, and resource use. Testing small production samples before full-scale operation also helps identify problems early and ensures that the final process remains stable, economical, and adaptable to different products.

Mason

Mason

Mason is a seasoned marketing professional with a deep expertise in the company's offerings and a passion for driving brand awareness. With a strong background in digital marketing strategies, he has an innate ability to connect with diverse audiences and effectively communicate product benefits.......